Profiling
CPU profiling (samply)
Setup
First you need to install samply. You can install it with:
cargo binstall samplyWARNING
Samply does not work well on macOS. We recommend using Xcode Instruments instead.
Build
To build Rolldown with the information required by samply, you need to build it with:
just build-rolldown-profileProfiling
After building, you can run Rolldown with the following command to profile CPU usage:
samply record node ./path/to/script-rolldown-is-used.jsIf you want to profile the JavaScript part as well, you can pass the required flags to Node:
samply record node --perf-prof --perf-basic-prof --perf-prof-unwinding-info --interpreted-frames-native-stack ./path/to/script-rolldown-is-used.jsCPU profiling (Xcode Instruments)
Setup
First, make sure you have Xcode installed.
Build
To build Rolldown with the information required by Xcode Instruments, you need to build it with:
just build-rolldown-profileProfiling
After building, you can run Rolldown with the following command to profile CPU usage:
xctrace record --template "Time Profile" --output . --launch -- node ./path/to/script-rolldown-is-used.jsthen the output file path will be printed. You can open the file with:
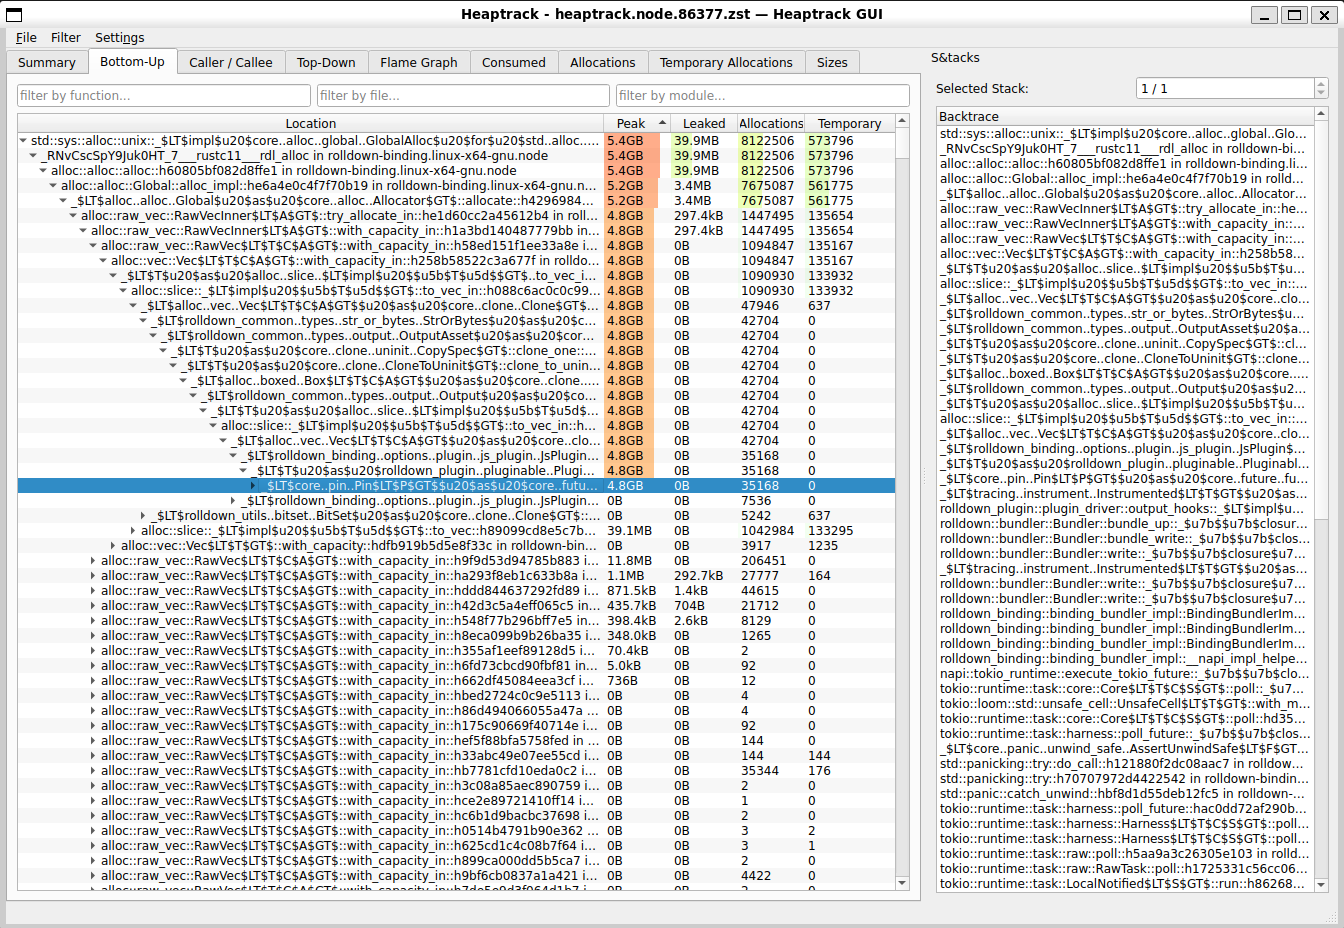
open ./Launch_node_yyyy-mm-dd_hh.mm.ss_hash.traceMemory profiling
To profile memory usage, you can use heaptrack.
Setup
First you need to install heaptrack and heaptrack-gui. If you are using Ubuntu, you can install it with:
sudo apt install heaptrack heaptrack-guiWARNING
heaptrack only supports Linux. It works fine on WSL.
Build
To build Rolldown with the information required by heaptrack, you need to build it with:
just build-rolldown-memory-profileProfiling
After building, you can run Rolldown with the following command to profile memory usage:
heaptrack node ./path/to/script-rolldown-is-used.jsUsing asdf or other version manager that uses shims?
In that case, you may need to use the actual path to the Node binary. For example, if you are using asdf, you can run it with:
heaptrack $(asdf which node) ./path/to/script-rolldown-is-used.jsThe heaptrack GUI will open automatically after the script finishes running.